Cities now support over half of the world’s
human population. They also support endemic
and threatened
wildlife. This wildlife provides multiple
ecological services to human urban populations, and also provides the daily
contact with nature that most of us now experience. However, our understanding
of how wildlife persists in urban environments, and how we can design and
manage cities to provide the best possible habitat for wildlife is still not
very well understood. One reason for this is due to the difficulties of
assessing biodiversity, especially in cities. Human surveyors have to consider safety
issues, survey equipment is vulnerable to vandalism, theft and destruction,
and getting access to private land to conduct surveys can be very bureaucratic.
Through my Engineering
Doctoral research (EngD) I developed new acoustic tools that can be used to
make it easier to assess biodiversity in urban environments. These tools should
hopefully be used in the future to better understand the biodiversity supported
by cities and to inform the design and management of cities for biodiversity.
Acoustics and biodiversity assessment
Lots of wildlife produce sounds, either by
vocalising – think a singing songbird - or through movements of their bodies –
think the hum from the rapid wingbeats of a bumblebee. Some species also make
sounds that cannot be heard by humans, such as the ultrasonic echolocations of
bats.
Ornithologists have used the
species-specific calls emitted by birds to identify calling species for
centuries. More recently, ultrasonic recorders have been used to record the
species-specific echolocation calls of bats which can be used to identify
species.
But these examples are very species-specific.
There are other species that live in cities such as insects and non-flying land
animals like foxes and squirrels that also make sound.
The field of
ecoacoustics uses the sounds emitted by all species to get a measure of
whole ecological communities, rather than focussing on specific species and
species groups. Ecoacoustic theory posits that the
soundscape (sounds at a landscape scale) of an environment is composed of
biophony (sounds emitted by non-human organisms), anthrophony (sounds
associated with human activities) and geophony (abiotic sounds such as wind and
rain).
 |
| The three elements that compose a soundscape: biophony, anthrophony and geophony. Image credit: Pijanowski et al. (2011) BioScience. |
New technology for ecoacoustics
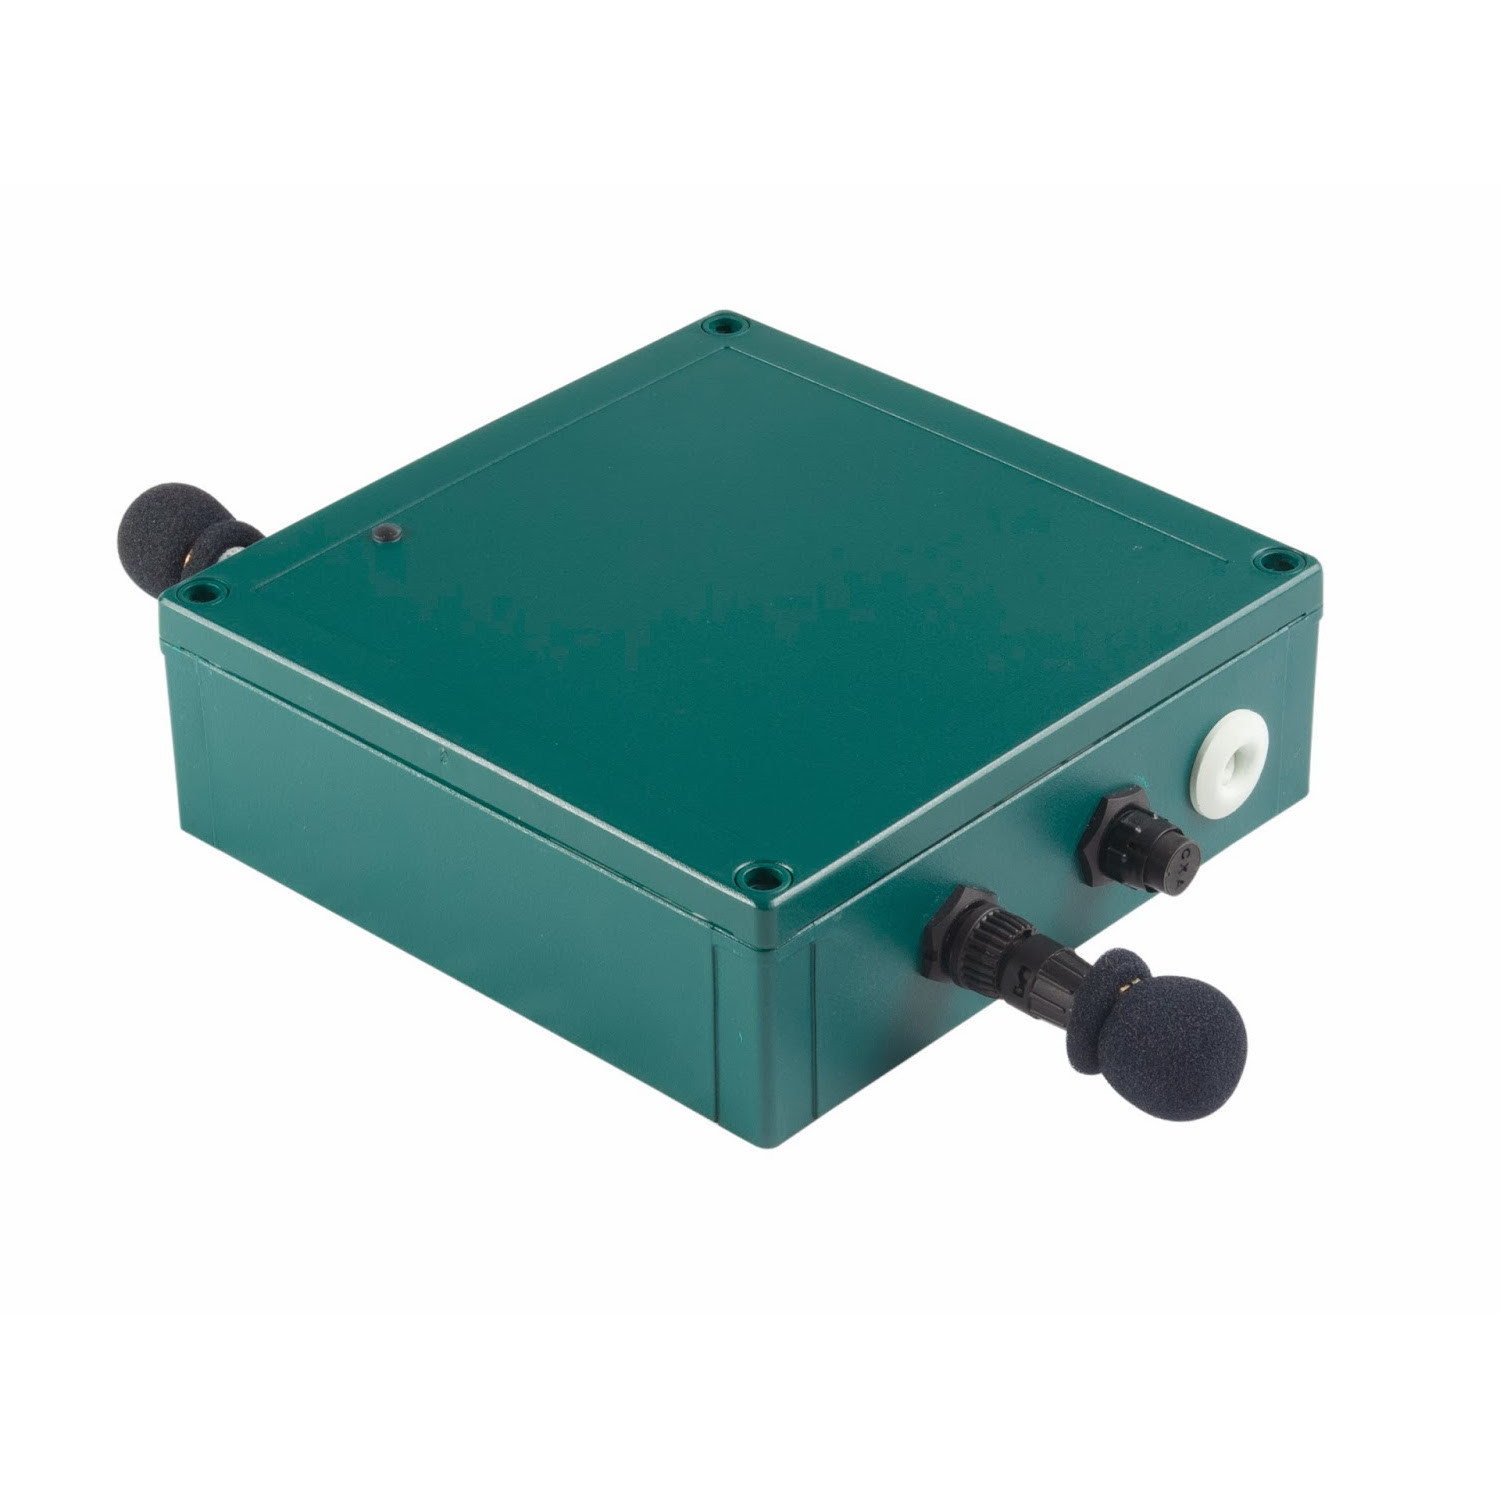
The use of ecoacoustics to monitor
biodiversity has really been made possible by the development of passive
acoustic recording technology, such as the very popular products from Wildlife Acoustics. These are
weather-proof acoustic recorders that can be left outside for long periods of
time, recording sound on a user-defined schedule. This technology is making it
possible for biodiversity scientists and conservationists to collect vast
amounts of acoustic recordings.
 |
| An SM2+ SongMeter is an example of a passive acoustic recorder that is commonly used in ecoacoustic research. These devices can be deployed in the environment recording at a pre-defined schedule for days/weeks/months at a time. Image credit: www.wildlifeacoustics.com. |
But what to do with all this acoustic data?
It is not practical or efficient to spend days/weeks/years listening to the
recordings that have been made.
To overcome this Big Data problem,
ecoacousticians have developed algorithms that can measure the biotic sound in
acoustic recordings producing a proxy measure of biodiversity. These algorithms
are called acoustic
indices and can be used to quickly produce measures of the biotic sound in
large volumes of acoustic data. They measure a few characteristics of the acoustic
data, such as the amount of sound at particular frequencies, to produce a
summary measure of biotic sound within an entire sound recording.
 |
| Acoustic indices produce measures of the biotic sound in audio recordings. Four commonly used acoustic indices include: A) Acoustic Complexity Index (ACI, Pieretti et al. 2011 Ecol. Indic.), B) Acoustic Diversity Index (ADI, Villanueva-Rivera et al. 2011 Landscape Ecol.), C) Bioacoustic Index (BI, Boelman et al. 2007 Ecol. Appl.) and D) Normalised Difference Soundscape Index (NDSI, Kasten et al. 2012 Ecol. Inform.). The ACI sums the absolute difference in signal power within frequency bins over time using a sliding window and defined temporal steps (indicated by arrow). The ADI is calculated as the Shannon’s diversity index for each recording based on the signal power occupancy of each 1 kHz frequency band. The BI calculates the signal power within 2-8 kHz frequency band of recordings. The NDSI calculates the ratio of signal power in the frequency bands between 1-2 kHz and 2-8 kHz to measure the level of anthropogenic disturbance on the landscape. |
Ecoacoustics in the city
However, ecoacoustic research and the
development of acoustic indices has tended to focus on less disturbed
environments than cities, such as temperate
woodlands, coastal
forests and Mediterranean
scrub. The challenge of my EngD research was to see if ecoacoustic could be
applied in this new, highly anthropogenically disturbed environment.
I started off by assessing the suitability
of a suite of commonly used acoustic indices for use in the urban environment.
I collected low (0-12kHz) and high (12-96kHz) frequency audio recordings from
15 churchyard sites across the Greater London area. I was lucky to collaborate
with the Diocese of London on this data collection while they conducted a London-wide
ecological survey of their churchyards.
 |
| Setting up my acoustic sensors |
To test exactly what sounds the acoustic
indices measured in the acoustic data, I listened to and manually labelled the
sounds in a random selection of my recordings. To do this, I co-developed AudioTagger, a bespoke audio
analysis software that allows you to quickly listen to and view audio
recordings, and draw labelled bounding boxes around sounds on spectrograms (a visual
representation of an audio recording).
 |
| AudioTagger in action. Sound recordings can be quickly listened to, viewed as spectrograms and annotated by drawing labelled bounding boxes around sounds of interest. Sounds labelled here include birds (blue boxes), electrical buzzes (pink) and road traffic (red). |
I identified a very wide
range of sounds in my recordings. Anthropogenic sounds dominated the
dataset and the variety was much greater than in previous ecoacoustic studies,
including sounds such as road traffic, sirens, church bells, footsteps, and
applause. Biotic sounds were mainly made by birds and bats, and geophonic
sounds were either wind or rain.
Of the four acoustic indices I tested, either
the measures of the acoustic indices did not correlate with the amount of
biotic sound in recordings, or were biased by non-biotic sounds in recordings (Fairbrass et al.2017).
Therefore, I would not recommend that any of the acoustic indices I tested are
used to assess biodiversity in urban environments.
Machine learning as an alternative to acoustic indices
Machine learning algorithms learn to
recognise patterns in data based on examples that they’ve seen previously, for
example how a spam email application learns to filter emails based on what a
user has previously marked as spam (skip to 32:38 for a great introduction to
machine learning).
Deep learning algorithms (a type of machine
learning) choose by themselves what characteristics define different groups of
data, rather than relying on humans to choose. Therefore they can use many more
parameters within data to characterise groups than a human ever could, making
them extremely powerful.
Machine learning algorithms are potentially
much more powerful than acoustic indices, as they do not rely on human defined characteristics
of data. What they do rely on is having a large dataset of labelled data with
which to learn the characteristics of different groups.
To train a deep learning algorithm that
could measure biotic sound in audio recordings from the urban environment
without being biased by the non-biotic sounds in the city, I collected audio
recordings from 63 sites across the Greater London area.
I used AudioTagger to label all the biotic,
anthropogenic and geophonic sounds in a random selection of 45 minutes of
recordings from each of the 63 sites. This labelled data was used to train and
test a pair of Convolutional Neural Network algorithms, CityNet (Fairbrass Firman et
al. in review), which
produce a measure of biotic and anthropogenic acoustic activity in noisy
acoustic recordings from the urban environment.
 |
| Audio data recorded at 63 green infrastructure sites in and around Greater London (A) was used to train (black dots) and test (red dots) the CityNet system. CityNet can be used to summarise the biotic and anthropogenic sounds in large volumes of audio data from noisy urban environments. A week of audio recordings are summarised here to produce daily average patterns of biotic and anthropogenic sound (B and C), which can be interesting to compare between different types of environments, such as sites in the centre (B) and on the outskirts (C) of the city. Image Credit: M. Firman |
The algorithms can be used to produce summaries
of the biotic and anthropogenic sound in large volumes of audio data from
cities – at http://londonsounds.org/ you
can explore the patterns of biotic and anthropogenic sound at my 63 study
sites.
Biotic sound as a proxy measure for biodiversity
An open question that remains in
ecoacoustics is whether biotic sound is a good proxy measure for biodiversity? And
does more biotic sound mean more or better biodiversity? Some have argued that due
to the way species avoid calling at the same time and frequency, more sound
does correlate with more diversity, but that this relationship only holds in
the tropics (Krause
& Farina 2016).
To investigate whether biotic sound can be
used as a proxy measure of habitats in cities, I conducted habitat surveys at
all my study sites and compared local and landscape habitat measures with the
biotic and anthropogenic acoustic activity and diversity.
Initial results suggest that there is a
relationship between the biotic sound recorded at a site, and the
characteristics of the local and landscape habitat. However, this research
needs a bit more work before I’m confident in the results, and I will continue
to work on this to try and answer the question of whether biotic sound can be
used as a proxy measure of habitats in cities.
Next steps
In this research I have found that existing
ecoacoustic tools in the form of acoustic indices are not suitable for use in
cities as they either do not measure biotic sound or are biased by non-biotic
sounds in recordings (Fairbrasset al. 2017). To overcome the
shortcomings of acoustic indices, I have developed deep learning tools,
CityNet (Fairbrass Firman et al. in review), which measure the biotic and anthropogenic sound in acoustic
recordings made in noisy urban environments. Finally, I have found that biotic
sound may be a good proxy for the characteristics of habitats in cities.
Cities are exciting places in which to
develop new technologies for assessing biodiversity because the availability of
power and Wifi connectivity makes it possible to develop autonomous systems for
monitoring wildlife. For example, smart sensors and machine learning algorithms
have been used to develop the world’s
first end-to-end system for monitoring bat populations in the urban environment
(www.naturesmartcities.com ). I
think it is important that machine learning and sensing technologies continue
to be used to improve our understanding of wildlife in cities, enabling us to
design and manage better cities for the future.